Graphs Info
GAINSS provides real-time insights into your testing progress through various widgets.
 TCs Authored by You
This widget shows the number of test cases authored by the logged-in user. It helps track the contributions of individual team members to the overall test suite and allows users to monitor their personal progress in test case creation.
Automation CoverageThis widget presents the percentage of total test cases that have been automated. It helps teams track the adoption of automation in their testing efforts, providing a clear picture of how much of the testing process is automated vs. manual.
Manual Test CyclesThis widget highlights the number of manual test cycles executed in the last 4 weeks.
Automated Test CyclesThis widget displays the number of fully automated test cycles executed in the last 4 weeks. By showing the trends and volume of automated test cycles, teams can assess the stability and maturity of their automated testing framework over time.
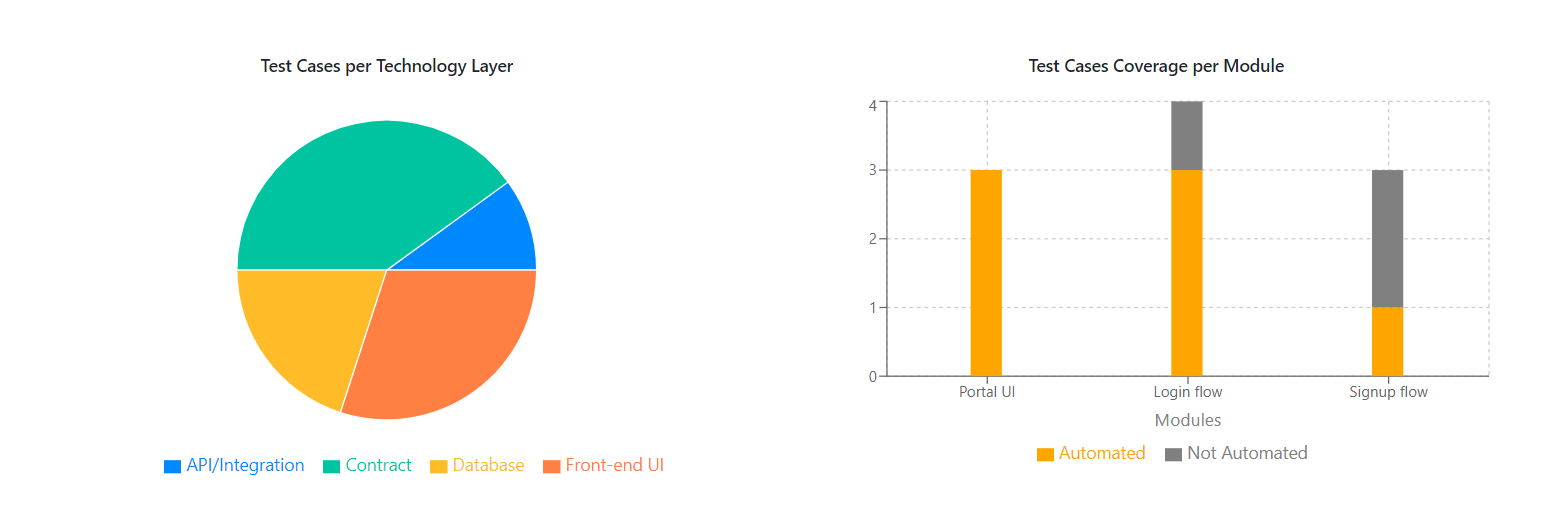
This graph provides a breakdown of test cases across different technology layers such as frontend, backend, database, etc. It helps visualize how test cases are distributed among various layers, ensuring balanced testing coverage.
This graph displays the percentage of test case coverage for each module. It allows teams to quickly see which modules have sufficient test coverage for thorough validation.
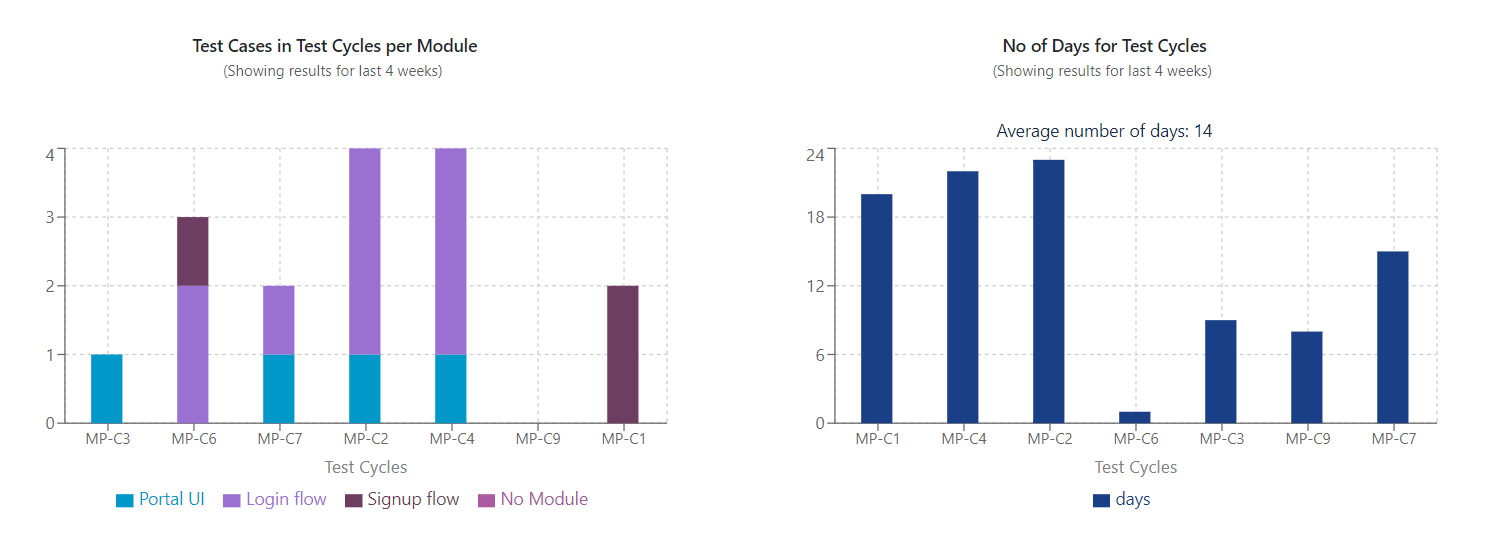
This graph shows how test cases are distributed across different modules during test cycles. It provides insights to help teams ensure that all modules are being tested in proportion to their complexity and importance.
This graph tracks the duration of each test cycle in terms of days. It offers insights into the efficiency of the testing process and identifying areas for improvement.
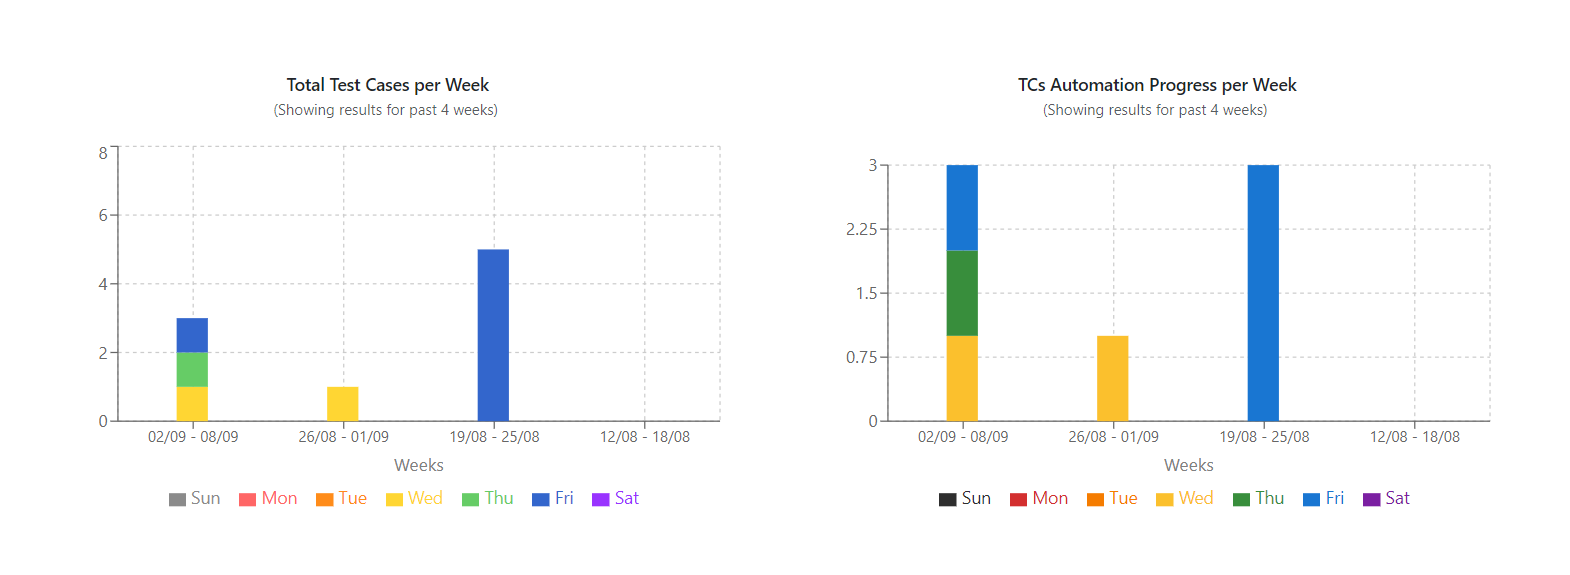
This graph displays the total number of test cases created each week. It helps track weekly test case activities, giving insight into the team’s testing velocity and how it changes over time.
This graph shows the weekly progress of automating test cases. It highlights the growth of the automation suite by tracking how many test cases have been automated each week.
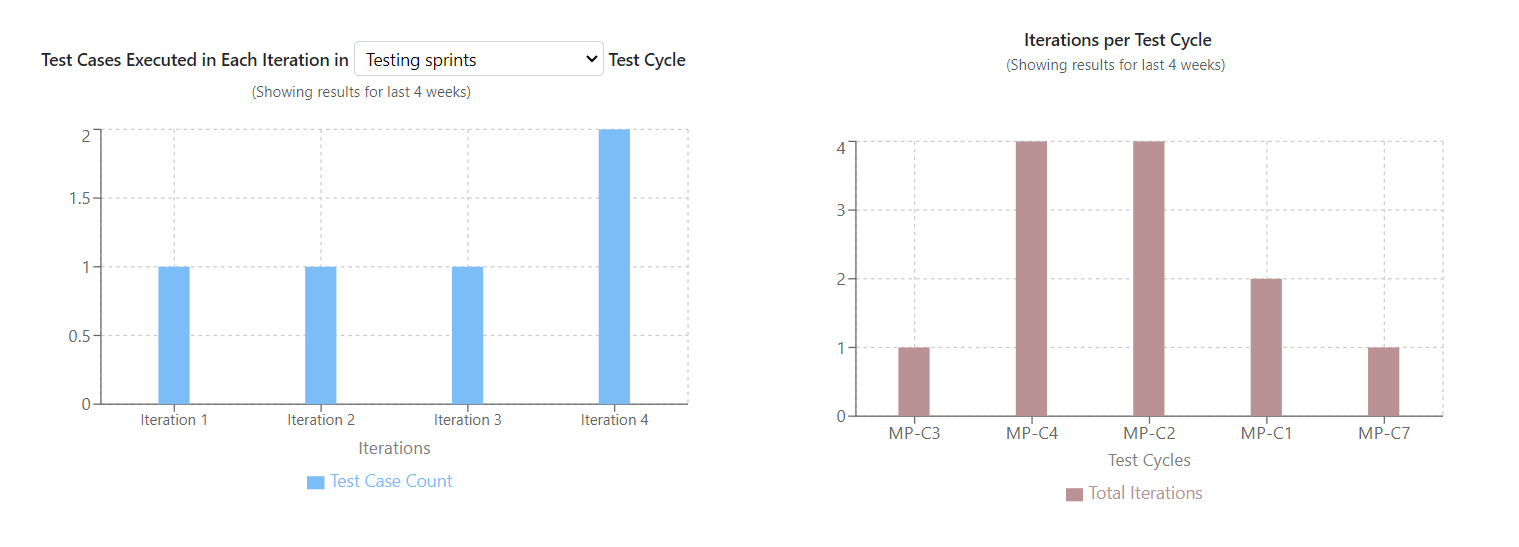
This graph displays the number of test cases executed during each iteration within a test cycle. It helps track the execution progress and ensures that testing is on schedule across iterations.
This graph shows the number of iterations within each test cycle. It provides insight into how many iterations are required to complete a cycle.
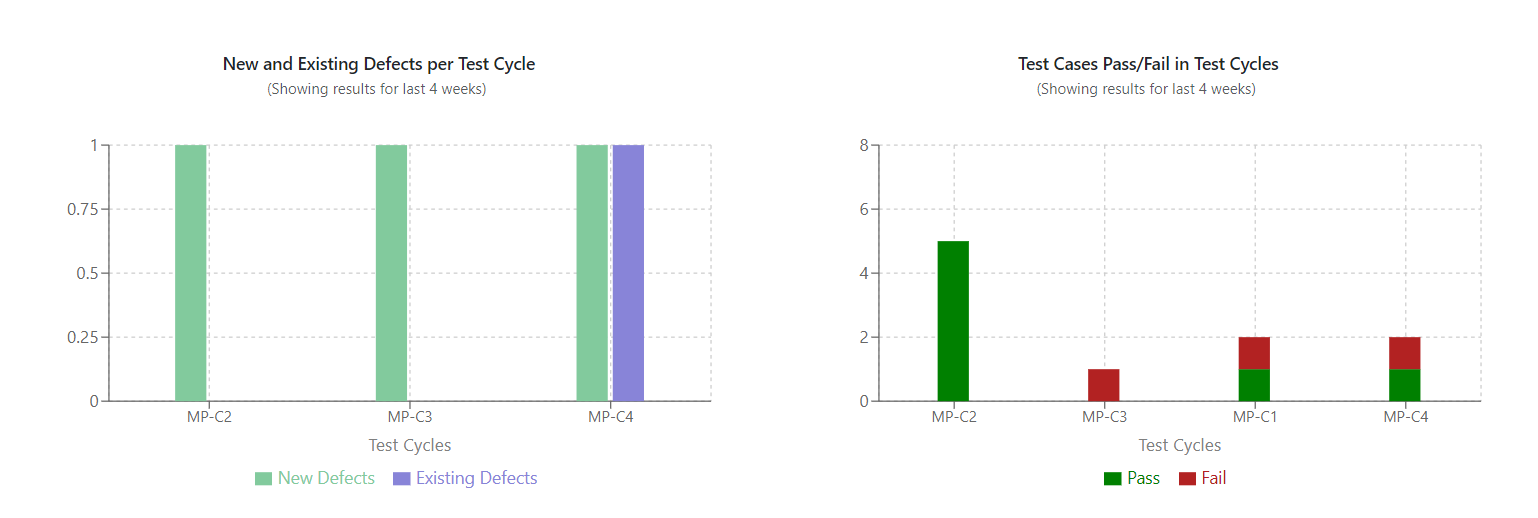
This graph tracks the number of new and existing defects identified during each test cycle. It visualizes defect trends, helping teams quickly assess the quality of the application and identify areas where defects are consistently occurring.
This graph shows the pass/fail rate of test case executions within test cycles. It allows teams to see the success rate of test executions and identify test cycles with high failure rates.
